


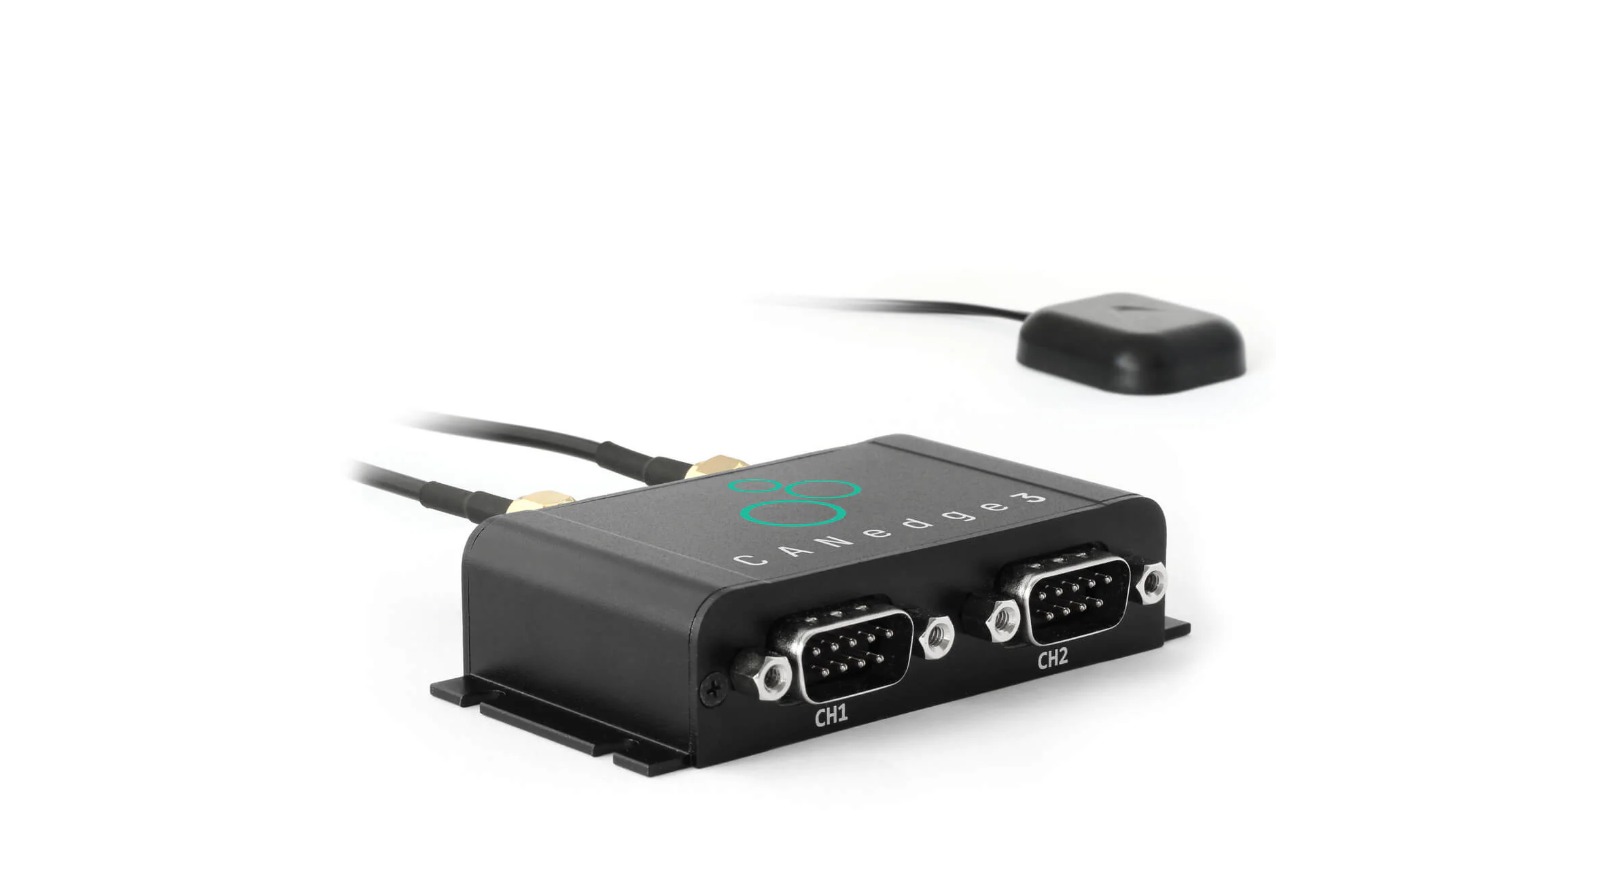
CSS Electronics’ new CANcloud OTA batch manager lets you push configuration, firmware, password and TLS certificate updates across your entire CANedge fleet in a single operation. Until now, every over-the-air (OTA) update in CANcloud — its free browser tool for managing CANedge2 and CANedge3 CAN bus data loggers — had to be pushed to one device at a time. This overview is based on CSS Electronics’ September 2026 newsletter and its CANcloud documentation. Pertech supplies CSS Electronics’ CANedge data loggers and CANmod modules in Israel, so we’ve summarized what’s changed and where it matters for fleet operators.

What is CANcloud?
CANcloud is CSS Electronics’ 100% free, open-source browser tool (published on GitHub) for managing CANedge2 and CANedge3 loggers and the log files they upload to your own S3-compatible server — AWS, Google Cloud, Azure or a self-hosted MinIO instance. From CANcloud you can browse and configure connected devices, monitor firmware and storage status, and push over-the-air (OTA) updates without installing anything beyond a browser.
From one device at a time to a full fleet in one operation
Previously, every OTA action in CANcloud — a configuration change, a firmware upgrade, a password reset, a certificate swap — had to be applied to one logger at a time. For a fleet running dozens or hundreds of CANedge devices, that made routine maintenance slow. The new batch manager keeps the same underlying update mechanisms but lets you target a whole cohort of devices, selected from a searchable device table, and run the update as a single batch.
| Capability | What it does |
|---|---|
| Partial config updates | Change just the settings that need to change — e.g. split size or filters — in the config editor on one device, then transfer only that edit to the batch. It’s merged on top of each device’s own Configuration File, so every other setting is left as-is. |
| Fleet firmware updates | Upload one firmware.bin and push it to every compatible device. If the new firmware needs a newer Configuration File schema, CANcloud migrates and writes each device’s config automatically before the firmware itself. |
| Password rotation | Enter new passwords once, in plain text, in the config editor, then enable “Encrypt passwords” for the batch. Each password is encrypted individually with that device’s own public key, so no cleartext credential is ever deployed. |
| TLS certificate rollout | Deploy a new certs_server.p7b bundle fleet-wide. Include both the old and new certificate in the bundle during a transition so devices stay connected before and after the switch. |
| Per-device validation | Every device is checked against its own Rule Schema before it can be selected, and re-validated against fresh data immediately before the update is written. Incompatible devices are excluded automatically, with the reason shown. |
| Searchable device table | Search and sort the fleet by device ID, meta name, device type, firmware version, last heartbeat, config sync state or status — e.g. to isolate every device still on an old firmware build and select the whole cohort in one click. |
| Diff view and live status | Review a per-device diff of exactly what will change before submitting a batch, then follow each device’s update status as the run progresses. |
Real-world example: AKSA’s E-COOLPAC fleet on CANedge3
AKSA Würenlos AG builds the E-COOLPAC, a fully electric mobile battery system that powers transport refrigeration units. Its customers need CAN bus data from the E-COOLPAC for monitoring, route planning and diagnostics. AKSA reads that data — from inverters, an on-board charger, a battery management system and several gateways talking CANopen and J1939 over a mobile PLC-based CAN bus — with a CANedge3. The logger stores the raw data to SD and uploads it over LTE to AKSA’s AWS S3 server whenever coverage is available, where it’s automatically DBC-decoded into physical values for AKSA’s own MYPAC telematics dashboard, giving dealers, technicians and customers traceability across each E-COOLPAC unit’s lifecycle.
“The CANedge3 is easy to integrate for transferring data to the cloud,” says Benjamin Ambiel, Product Manager at AKSA. With the data online, AKSA’s customers can plan truck routes around battery state of charge and schedule maintenance before a failure happens, while AKSA’s own service technicians can read machine data remotely rather than waiting for an on-site visit.
Frequently asked questions
Do I still need to update CANedge devices one at a time?
No — that’s what the batch manager changes. Config, firmware, password and certificate updates in CANcloud can now be selected from the device table and pushed to a whole cohort of devices in a single run, with each device still individually validated and updated behind the scenes.
Is CANcloud free to use?
Yes. CANcloud is CSS Electronics’ free, open-source browser tool for managing CANedge2/CANedge3 devices and the data they upload to your own S3-compatible server. There’s no separate license fee for the OTA batch manager.
Can I roll out a new TLS certificate without losing connectivity to devices already in the field?
Yes, as long as the certs_server.p7b bundle used for the transition batch includes both the old and new certificate. That lets each device authenticate with either one until you retire the old certificate in a follow-up update.
Further reading: CSS Electronics’ CANedge documentation, the CANcloud project on GitHub, and the full AKSA E-COOLPAC case study.