




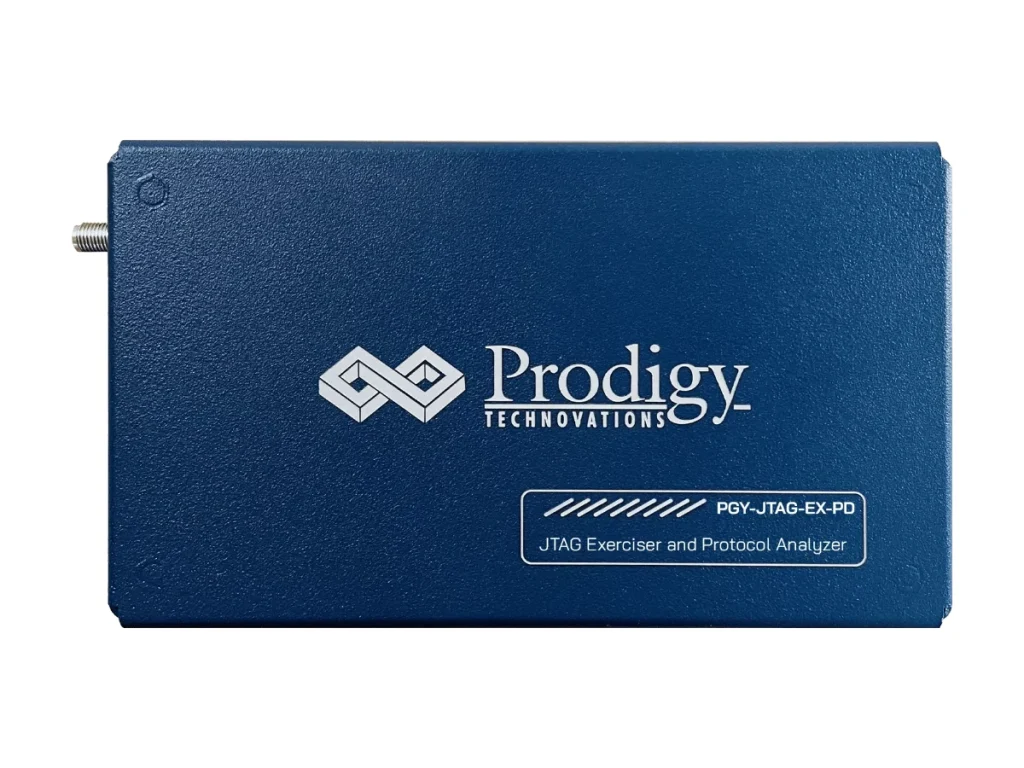
The Prodigy JTAG Protocol Exerciser and Analyzer (PGY-JTAG-EX-PD) generates and decodes JTAG traffic to validate a design’s JTAG port against its specification. As JTAG master it drives TCK from 100 kHz to 25 MHz with adjustable duty cycle, delays and voltage, while decoding TCK, TMS, TDI and TDO on the same bus at the same time. Scripts combine instruction and data writes at different speeds, so timing margins and corner cases can be tested and repeated. Pertech is the authorized Prodigy distributor.
JTAG analyzer or JTAG debug probe?
A JTAG debug probe connects an IDE to a processor so you can debug software. This instrument tests the JTAG interface itself: it drives the port with controlled timing and decodes every transition. For software debugging of Arm devices, see the Arm Keil ULINK family and Arm DSTREAM-ST.
JTAG analyzer highlights
- JTAG master with custom traffic generation from the GUI or scripts
- TCK from 100 kHz to 25 MHz, duty cycle of 25, 50 or 75 percent
- Drive levels of 1.2, 1.8 and 3.3 V
- User-defined TCK to TDI and TCK to TMS delays, and delay between messages
- Generates traffic and decodes the bus simultaneously, with continuous streaming to the host disk
- Timing view of TCK, TMS, TDI and TDO with a bus diagram, and a protocol listing correlated to the waveform
- Error analysis in the decoded protocol
- Python and C++ API for automation
Where the JTAG analyzer earns its keep
- Validating the JTAG test access port of new ASICs, FPGAs and SoCs
- Measuring timing margins by sweeping TCK speed, duty cycle and signal delays
- Scripted, repeatable instruction and data register sequences for regression testing
- Decoding the traffic between an existing debugger or tester and the target to find where a sequence fails
Key Specifications
| Spec | Value |
|---|---|
| Model | PGY-JTAG-EX-PD |
| Configuration | 1 master |
| TCK frequency | 100 kHz to 25 MHz |
| Drive level | 1.2, 1.8 and 3.3 V |
| Duty cycle | 25, 50 or 75% |
| Delays | User-defined TCK-TDI, TCK-TMS and between messages |
| Protocol views | Timing diagram, protocol listing, bus diagram |
| Capture | Continuous streaming to host HDD or SSD |
| API | Python and C++ |
| Host connection | USB 2.0/3.0 |
Frequently asked questions
What is a JTAG protocol analyzer used for?
It captures and decodes JTAG traffic so engineers can see each TAP transition, instruction and data transfer, and find where a sequence or its timing breaks. With the exerciser, the same unit also drives the port with controlled traffic.
What TCK speeds does the Prodigy JTAG analyzer support?
TCK runs from 100 kHz to 25 MHz, with a 25, 50 or 75 percent duty cycle and user-defined TCK to TDI and TCK to TMS delays.
Can JTAG sequences be scripted?
Yes. Scripts set frequency, duty cycle and delays, then issue instruction writes, data writes and IR reads, combining frames at different speeds. A Python and C++ API supports full automation.
Is this a replacement for a JTAG debugger?
No. A debugger such as an Arm ULINK or DSTREAM probe is for debugging software through JTAG. The Prodigy instrument validates the JTAG interface and its timing, and decodes traffic from any source.
Where can I buy the Prodigy JTAG analyzer in Israel?
Pertech is the authorized Prodigy distributor. Prodigy offers evaluation units, free online technical support and free software updates. Contact Pertech for a quote or a demo.
Related Prodigy products at Pertech
- I2C/SPI Exerciser and Protocol Analyzer
- MDIO Protocol Exerciser and Analyzer
- Prodigy protocol analyzers at Pertech
Validating a JTAG port? Contact Pertech for a quote, a demo or help choosing the right tool.
