
From Pertech, an ASSET InterTech distributor.
Pertech is an ASSET InterTech distributor, supplying SourcePoint JTAG debuggers with Arium probes, and ScanWorks boundary-scan test, to firmware, BIOS and hardware teams in Israel.
SourcePoint is a source-level debugger that controls the processor over JTAG from the moment it leaves reset, before BIOS, a boot loader or an operating system has run. Engineers step through UEFI PEI and DXE code, set hardware breakpoints, break on System Management Mode entry and exit, and record execution with Intel Processor Trace, on Intel Core, Xeon and Atom platforms, AMD EPYC servers and Arm SoCs.
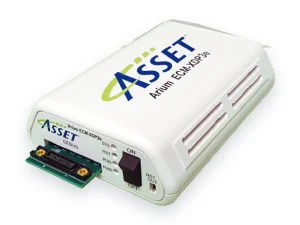
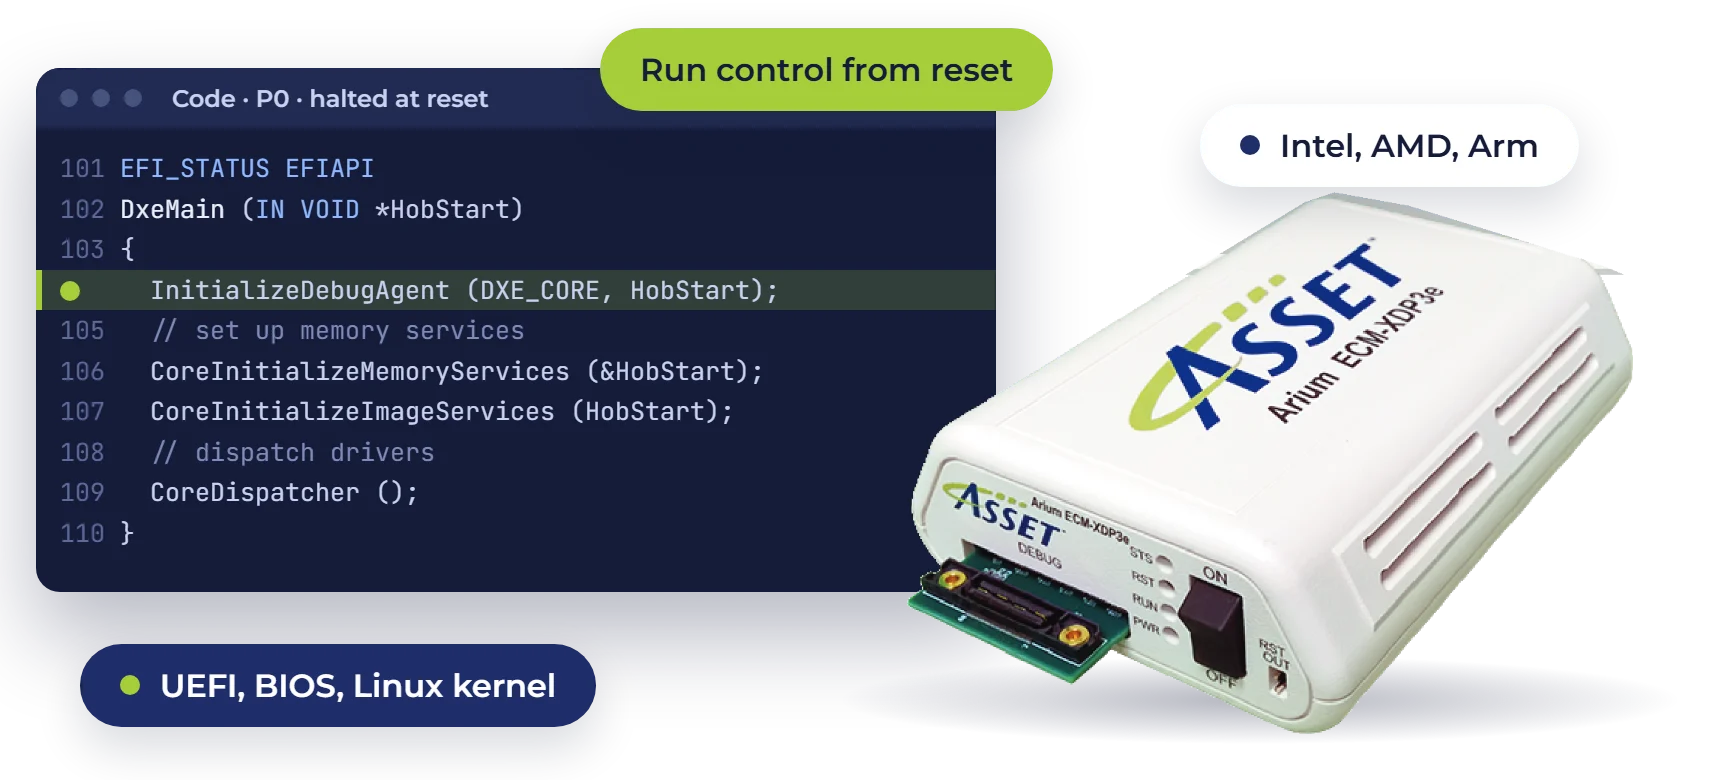
SourcePoint connects through Arium run-control probes such as the ECM-XDP3e on XDP debug headers, with adapters for MIPI and SFF-26 headers, or over a single USB cable on Intel targets with Direct Connect Interface (DCI). SourcePoint WinDbg adds Windows OS awareness for kernel, hypervisor and security research.
ScanWorks applies IEEE 1149.x boundary scan to boards in development and production: model-based tests for interconnects, memories and clusters, flash and CPLD programming, diagnostics down to the failing pin and net, and IJTAG (IEEE 1687) instrument access.
Security gap analysis means comparing what a system is supposed to enforce (a requirement, a compliance control, a threat-model assumption) against what it actually does at runtime. For platform firmware, that comparison usually breaks down exactly where conventional software-security tooling stops working: before the OS boots, inside System Management Mode, or inside a hypervisor's protected state. SourcePoint's JTAG hardware debug and real-time trace let an engineer observe that runtime behavior directly, silicon-side, which is what turns a paper security review into evidence-based gap analysis. Engineers use it to identify:
In short: SourcePoint doesn't replace static analysis, code review or fuzzing, it fills the gap those methods can't reach, because it observes the platform at the one layer (JTAG, pre-OS, SMM, hardware trace) where a firmware security assumption either holds up against real hardware or it doesn't.
SourcePoint is a JTAG-based, source-level debugger for firmware and low-level software on Intel, AMD and Arm processors. It gives run control from reset, hardware and software breakpoints, register, memory and PCI views, execution trace, and scripting in a C-like command language and Python.
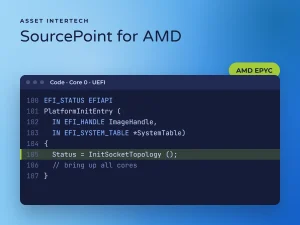
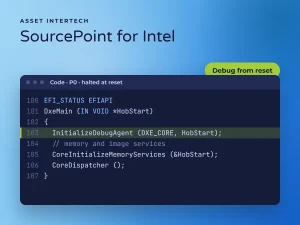
Yes. SourcePoint halts the processor at the reset vector and debugs UEFI firmware at the source level from the reset vector through the PEI and DXE phases, with breakpoints, single step, variables and call stacks. It also breaks on System Management Mode (SMM) entry and exit, so SMM handlers can be inspected.
Intel Core, Xeon and Atom processors, including current client silicon (SourcePoint for Intel 7.14.0 adds Nova Lake-S, October 2026), AMD EPYC server processors, and multi-core Arm SoCs with CoreSight trace. Pertech can confirm support for your exact platform.
On Intel targets with an XDP debug header, the Arium ECM-XDP3e probe connects SourcePoint over USB or Ethernet. Targets with a MIPI or SFF-26 debug header use an adapter. On Intel targets with Direct Connect Interface (DCI), SourcePoint can connect over a single USB cable with no probe. Earlier platforms use the ECM-XDP3.
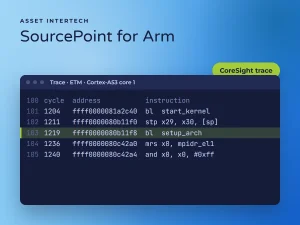
Yes. On Intel it uses Intel Processor Trace, Architectural Event Trace and the Intel Trace Hub to record what the code actually executed, and its trace search builds a call tree with time per function. On Arm it uses the CoreSight trace macrocells.
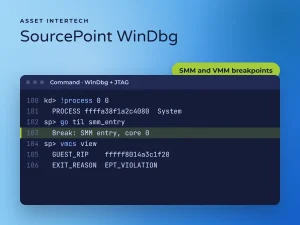
SourcePoint WinDbg combines SourcePoint JTAG debug with Microsoft WinDbg, giving Windows OS awareness together with SMM and VMM breakpoints, Intel Processor Trace and a VMCS viewer. It is used for Windows kernel, hypervisor and security research. A lower-cost Home edition is available for individual researchers.
Intel Customer Scripts (CScripts) are Python scripts that Intel provides for platform debug, error analysis and error injection. SourcePoint for Intel runs them from its Python command line, and ASSET verifies new CScript releases against SourcePoint.
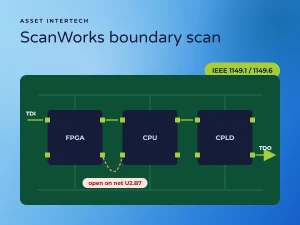
ScanWorks is ASSET's IEEE 1149.1 and 1149.6 boundary-scan platform. It generates interconnect, pull-up and pull-down, memory and cluster tests from the board netlist, programs flash, CPLDs and FPGAs, and reports failures down to the pin and net. Developer licenses build the tests, and operator licenses run them in production and at contract manufacturers.
SourcePoint licenses can be node-locked to one PC or floating on a license server and shared between probes. ScanWorks licenses are perpetual, with optional annual support and maintenance. ASSET and Pertech offer hands-on SourcePoint training.
Pertech is an ASSET InterTech distributor in Israel. Contact Pertech for a quote, a demo or an evaluation, or to check that your platform and debug header are supported.