Epoch is eShard’s time travel debugging tool. It records everything a system does in one trace, including the kernel, drivers and every running process. Analysts and AI agents can move forwards and backwards through the recording. They can study exactly how the system reached a crash, a vulnerability or suspicious behaviour, as many times as needed.
A classic debugger watches a program while it runs and mostly moves forwards. If you step past the moment that matters, you restart and try to reproduce the problem. Some problems do not recur. A race condition that appears once in a thousand runs can be hard to catch live. So can a kernel panic that depends on timing, or malware that only unpacks its payload under specific conditions.
Time travel debugging records the complete execution once in a deterministic trace. You can then navigate the recording, step backwards from a crash to its cause, and revisit any moment. The recording stays the same each time.
Many record-and-replay tools capture one process. Bugs often cross process and system boundaries. A malformed input can arrive through a network driver, pass through a system service, enter a shared library and finally crash the app. Epoch records the kernel, drivers and every userland process together in one trace. You can follow a value from its entry into the system to the point where it caused harm. You do not need to switch tools or guess what happened between those points.
Epoch has three parts, each covering a step in the investigation.
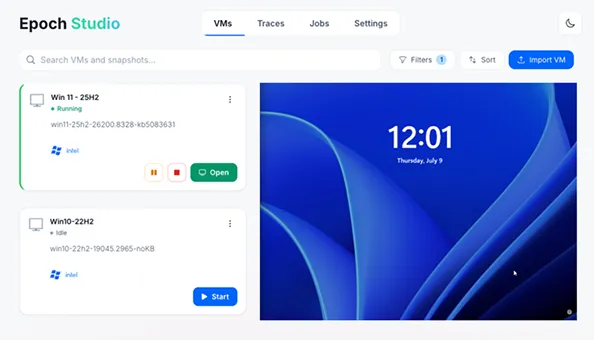
Epoch Studio manages the virtual machines that run your target. It provides the same experience across Windows, Linux and Android. You prepare the environment, save snapshots of useful states, and record. Epoch captures the full execution in one pass. It writes every instruction, memory change and register state to a persistent trace file. Snapshots let you return to a prepared state and record again without starting over.
Epoch Analysis lets you explore the recording:
The trace preserves the recorded state. Analysts can reproduce race conditions and kernel panics in full every time.
Full-system traces are large. A few seconds of activity can contain billions of instructions. Epoch turns the recording into a structured dataset that an AI agent can query through Epoch's local MCP server. The agent can search runtime strings, inspect instructions and registers, read memory and follow data accesses. It can flag likely vulnerability patterns, propose root causes and tag the trace. You can then check the evidence in Epoch Analysis.
Typical questions for the agent include "Does this trace contain a ROP chain?", "Where does this register value come from?" and "What first wrote to this address?"
eShard has published these results:
All of this runs on-premise. Your traces, proprietary code and malware samples stay in your environment.
| Plan | Recording (Epoch Studio) | Analysis and AI |
|---|---|---|
| Intel | Full-system tracing of Windows 10/11 and Linux | Kernel and user space inspection, full memory access, memory access history, automatic symbol resolution, taint analysis, AI-assisted recording and trace analysis |
| Arm | Full-system tracing of Linux and Android; IoT through Qiling and Unicorn dynamic tracing | Same as Intel |
| Android Emulator (add-on) | QEMU-based Android virtual machine with Google services. Tested with a Google Pixel 6 image running Android 12. Needs the Arm plan | Same as Intel |
All plans run on the esReverse platform.
Epoch is the successor to Reven, eShard's earlier time travel analysis software, sometimes listed as esReven. It keeps Reven's core analysis features, including memory history, taint analysis, full-trace memory search and scripting. It adds simpler target preparation, a faster trace interface and AI agent access. According to eShard, existing Reven customers receive Epoch automatically.
| Live (traditional) debugger | Epoch time travel debugging | |
|---|---|---|
| Direction | Forward only. Missing a clue means restarting | Forward and backward, as often as needed |
| Scope | Usually one process at a time | The whole system: kernel, drivers and every userland process |
| Platforms | Often tied to one operating system | Windows, Linux, Android and IoT |
| Reproducing a bug | Manual, and rare bugs may not appear again | Record once, then replay the same execution any number of times |
| Memory insight | The current state only | Memory at every instruction, access history and taint analysis |
| AI | Not built in | AI agents query the trace through a local MCP server |
Live debuggers remain the right tool for simple bugs in a straightforward workflow. Time travel debugging helps when a problem crosses process boundaries, depends on timing or comes from code that appears only at runtime.
Getting started with Pertech takes a few steps. First, try the browser demo to see the interface. Then agree on a target with us: a binary, an Android app or a firmware image that matters to your team. We arrange a session with eShard to record and analyse the target, with or without the AI agent. If the solution fits your needs, we size the server and choose the Intel plan, the Arm plan or both. We then install esReverse and Epoch on your network and train your analysts.
Epoch works alongside your disassembler and debugger. Disassemblers help you understand the code. Epoch helps you understand its execution. They work together in esReverse, which connects to Ghidra, IDA, Binary Ninja, GDB and other tools.
eShard provides a browser-based Epoch demo with no installation or account required. Pertech can also arrange a session on your own targets.
Time travel debugging records a program's or system's execution so you can move backwards and forwards through it. You can examine a bug without restarting the program to catch it again.
Epoch is eShard's full-system time travel debugging tool. It records the kernel, drivers and every process in one deterministic trace. It runs on the esReverse platform.
Backward debugging means stepping backwards through a program's recorded execution, from an effect such as a crash to its cause. Epoch supports it because it records the whole execution in advance.
Epoch records the whole system, including the kernel and drivers, while WinDbg TTD records selected user-mode processes on Windows. Epoch also covers Linux, Android and IoT targets on Arm.
Epoch is the successor to Reven, eShard's earlier time travel analysis software. It keeps Reven's analysis features and adds simpler target preparation and AI agent access. eShard says existing Reven customers receive Epoch automatically.
An AI agent helps with time travel debugging in Epoch by querying the recorded trace through a local MCP server. It can search strings, read memory, follow data and tag findings across billions of instructions. It then points the analyst to the evidence.
Epoch records Android at full-system level with the Arm plan. This includes a QEMU-based Android emulator that eShard has tested with a Pixel 6 image running Android 12.
No. Epoch AI does not need to send traces to the cloud. It uses a local MCP server and can work with a model hosted on your own servers.
Epoch works with your existing debugger and disassembler. It runs in esReverse, which connects to Ghidra, IDA, Binary Ninja, GDB and other tools.
You can try Epoch time travel debugging through eShard's free browser demo at ttd.eshard.com. Pertech can also arrange an evaluation on your own targets in Israel.
You can buy Epoch from Pertech Embedded Solutions, eShard's partner in Israel. Pertech provides quotes, installation and local support.