
ASSET InterTech is a US-based provider of embedded system validation and debug solutions, serving aerospace & defense, medical device, telecom, enterprise PCB and manufacturing companies since the 1990s. Its SourcePoint™ debugger gives firmware and BIOS engineers JTAG hardware-assisted, source-level visibility into Intel, AMD and Arm-based systems — starting from cold reset, before an operating system or even working RAM exists — and was the first tool on the market to offer Intel® UEFI debug.

ASSET InterTech builds two complementary product lines for hardware bring-up and production test: ScanWorks®, a JTAG/boundary-scan structural test platform used in R&D, repair and manufacturing, and SourcePoint™, a source-level processor debugger built around Arium run-control probes and trace port analyzers. Pertech supplies and supports the SourcePoint line for customers in Israel.
SourcePoint connects to the target over JTAG (including Intel's Direct Connect Interface) and gives developers a real-time, source-level debug interface that works straight out of reset — before BIOS, a bootloader or an OS has initialized anything. It covers the processors most embedded and platform teams actually ship on:
On the host side, SourcePoint reads C/C++ source, symbol and mixed (source+assembly) views, and understands .elf, .hex, .sym and .bin images as well as Windows .exe/.dll/.efi (PE format) binaries. It is Linux OS-aware, with kernel and insmod debug, supports multi-processor and multi-cluster targets, and is scriptable through both a C-like command language and Python — so routine bring-up sequences, register checks or regression scenarios can be automated instead of clicked through by hand.
SourcePoint was the first tool to offer Intel UEFI debug, and it still leads on depth of platform-firmware support. It debugs Framework-for-UEFI platforms natively — PEI, DXE and later EFI phases — with breakpoints, single-step, variable inspection and call-stack views available throughout, plus UEFI-aware code navigation with macro support. That makes it equally useful for:
SourcePoint also supports Intel Customer Scripts (CScripts) — Python-based scripts, provided directly by Intel under NDA, that exercise silicon-specific and platform debug, error-analysis and error-injection features from inside SourcePoint's own Python command-line interface. ASSET maintains a dedicated resource to verify each new Intel CScript release against the current SourcePoint build.
Security gap analysis means comparing what a system is supposed to enforce — a requirement, a compliance control, a threat-model assumption — against what it actually does at runtime. For platform firmware, that comparison usually breaks down exactly where conventional software-security tooling stops working: before the OS boots, inside System Management Mode, or inside a hypervisor's protected state. SourcePoint's JTAG hardware debug and real-time trace let an engineer observe that runtime behavior directly, silicon-side, which is what turns a paper security review into evidence-based gap analysis. Engineers use it to identify:
In short: SourcePoint doesn't replace static analysis, code review or fuzzing — it fills the gap those methods can't reach, because it observes the platform at the one layer (JTAG, pre-OS, SMM, hardware trace) where a firmware security assumption either holds up against real hardware or it doesn't.
Being able to step through code is only half the picture — SourcePoint's trace window adds cycle-accurate, time-stamped execution history, and its trace search tool turns that raw trace into a call tree with inclusive/exclusive timing per function, so a performance or intermittent-failure investigation starts from "where is the time actually going" rather than a blind single-step session.
Run-control is built around familiar go/halt/step semantics, extended by SourcePoint's own C-like command language (loops, data and array variables, file I/O) so multi-step debug sequences can be scripted rather than repeated by hand. Breakpoints — hardware (up to 32 debug registers, depending on processor) and unlimited software — can be set from the Code window or the command line, alongside:
Symbols, Registers, Memory, PCI Devices and user-defined Watch windows expose live processor state, with independent views per core in multi-processor targets — plus a user-defined window for grouping memory-mapped I/O devices and their registers, so a chip's control-plane state stays in one place instead of scattered across several windows.
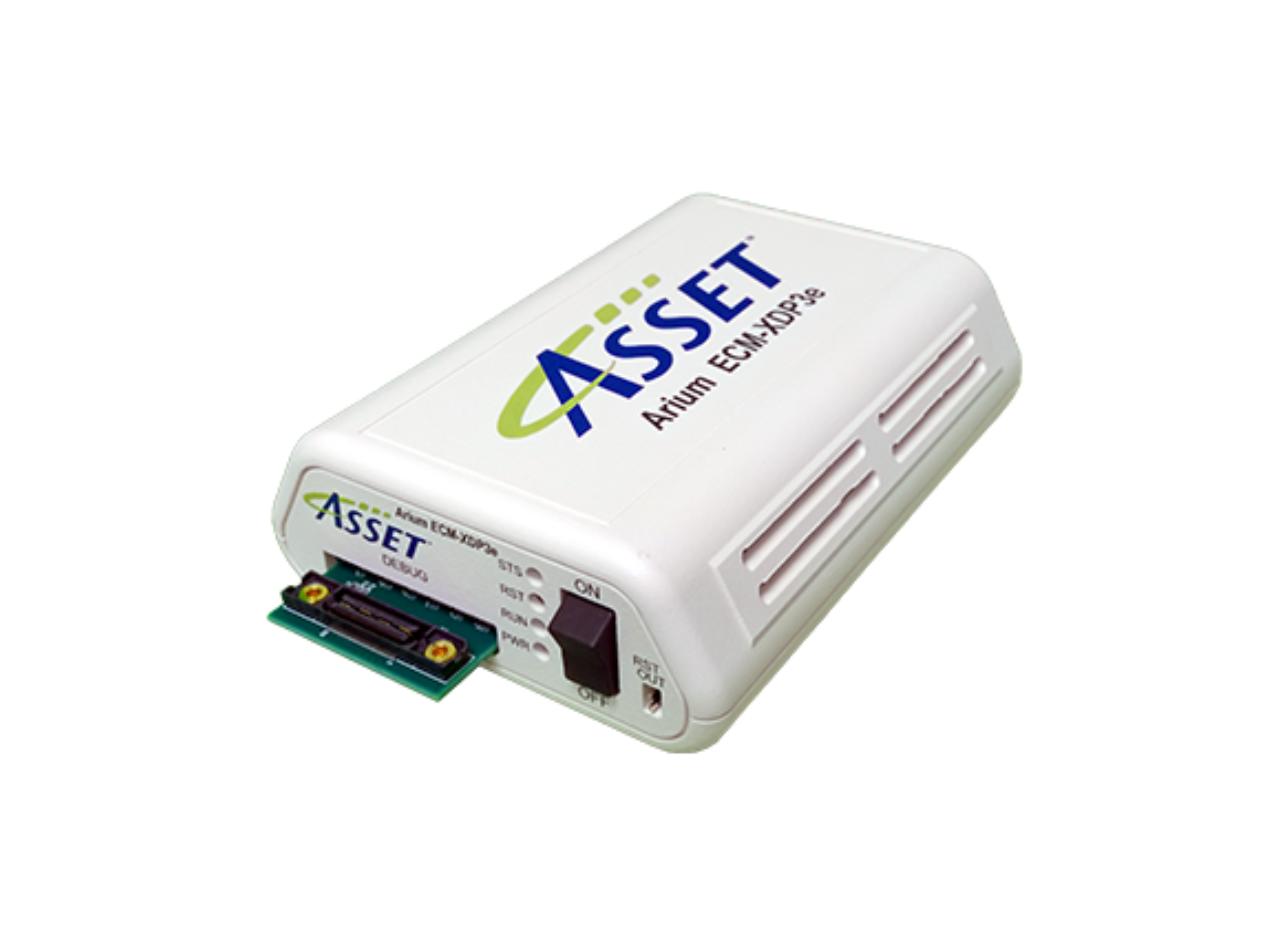
The Arium ECM-XDP3e — the JTAG run-control probe SourcePoint connects through via the Intel XDP interface.
SourcePoint for Intel is designed around ASSET's own Arium run-control probes and trace port analyzers:
Together the probes cover real, virtual-86, big-real, protected and system-management-mode (SMM) address translation, and a full register set — 386, system, control, debug, MSRs, floating point, MMX and SSE. Source and symbolic debug formats include boot-loadable OMF-386, DWARF2, Intel Textsym, CodeView and a.out/Stabs, and downloadable image formats span BIN, OMF-386, ELF32, DOS EXE, Intel Hex and PE32/PE32+.
| Target processors | Intel Core / Xeon / Atom SoC, AMD EPYC, Arm multi-core/multi-thread SoCs |
|---|---|
| Connection | JTAG via Arium ECM-XDP3 or LX-1000 probes; Intel Direct Connect Interface (DCI) |
| UEFI/BIOS debug | Source-level debug of PEI, DXE and EFI phases; Intel CScripts (Python CLI) support |
| Trace | Cycle-accurate execution trace, Intel Processor Trace (IPT), AET (LX-1000), Arm CoreSight |
| Command languages | C-like scripting language, Python |
| Host OS | Windows 7/8+ (32/64-bit), Linux (Ubuntu, CentOS and other modern distributions) |
| File formats | ELF32, OMF-386, BIN, Intel Hex, DOS EXE, PE32/PE32+, DWARF2, CodeView, a.out/Stabs |
Pertech supplies and supports ASSET InterTech's SourcePoint debug tools for customers in Israel — evaluation, licensing, onboarding and ongoing local technical support, alongside the rest of Pertech's embedded development and test-and-measurement lines. Contact us to scope which SourcePoint configuration and Arium probe fit your target processor and debug workflow.
What's the difference between SourcePoint and a plain JTAG debugger?
Most JTAG debuggers only support run control (halt, step, breakpoints) at the register/assembly level once an OS or simple monitor is running. SourcePoint adds source-level C/C++ debug, native UEFI/BIOS debug from cold reset before any OS exists, cycle-accurate execution trace, and a scriptable C-like/Python command interface — so it covers platform bring-up as well as later-stage software debug.
Does SourcePoint support UEFI and BIOS debug, or only OS-level debug?
UEFI/BIOS debug is one of SourcePoint's core strengths — it was the first tool to offer Intel UEFI debug and provides native source-level debug of the PEI, DXE and EFI phases of Framework-for-UEFI platforms, including breakpoints, single-step, variable inspection and call-stack views during boot.
Which processor architectures does SourcePoint support?
SourcePoint for Intel covers Intel Core, Xeon and Atom SoC processors; SourcePoint also supports AMD EPYC server CPUs and Arm multi-core/multi-thread SoCs with CoreSight trace, connecting over JTAG through ASSET's Arium ECM-XDP3 or LX-1000 probes.